Sapient
How do we enable physicians to have a better understanding of their practice’s financial health without navigating a large sea of big-data?
Sapient is a responsive web experience that allows physicians to conveniently understand the financial performance of their practices. Previously, physicians would have to navigate medical accounting jargon and complex visualizations to get a snapshot of their revenue performance.
Research
Interviews
I conducted interviews with a subset of our physician clients to get to the heart of what they truly cared about seeing on a monthly basis. I also discovered their pain points with the previous product they were using.
Surveys
For 30 other physician clients/analysts across the county, I sent out a survey to gather feedback from a wider variety of client personas and practice types. As part of the survey, I had them rate key aspects of the current software offering on a Likert scale. I would later perform a quantitative and qualitative analysis on the data.
Personas
From our interviews, we identified several personas that would use this product in a medical practice setting — physicians themselves, and practice administrators.
Affinity mapping
I mapped out all of the data I acquired from the interviews and surveys on post it notes and sorted them on a wall to help me synthesize the data down to common trends.

Key User Goals
Physician:
• "Better mobile capability would be great. I travel and having key metrics, in real time, on my phone would be a huge win."
• "Optimizing revenue is important. I want to monitor and troubleshoot performance, as well as identify trends and ensure consistency of service."
• "I want to monitor daily & monthly productivity, and other quality metrics."
Practice Administrator:
• "I feel ill equipped to answer management questions."
• "I want to quickly diagnose issues that may cause revenue loss/delays."
• "I would like to obtain information used in the management of the medical practice, both for billing and to drive practice revenue growth and operational efficiency."
Solutions

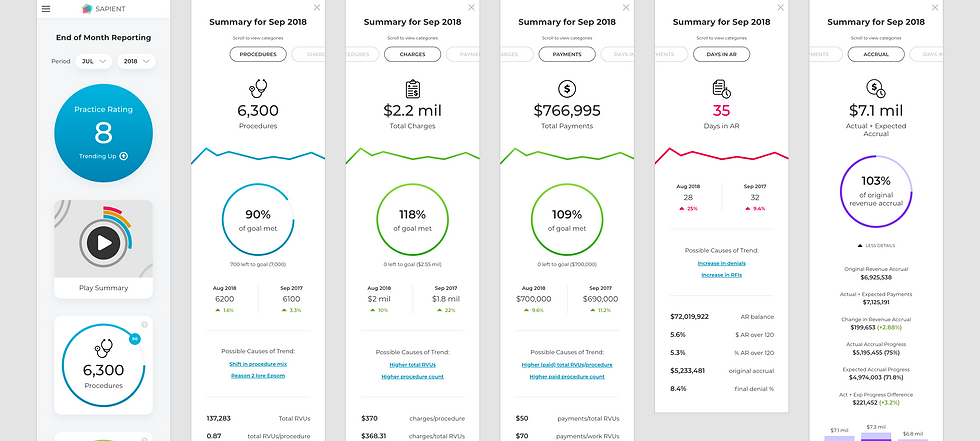
We discovered 5 common points of interest when it comes to a practice’s financial health, and we surfaced those 5 items by default. We also discovered different physicians wanted to see different things about their practice, so I designed a dashboard with fully customizable tiles to surface only the data they care about.
The tile system at the macro level shows progress toward a monthly goal, for a high level view of practice health.
Physicians who cared about the minute details of their practice can drill into the tiles and see more detailed information about their practice, including daily performance trends. We also surface potential causes of dips in performance and provide smart recommendations for recovering from them.


Two way communication with a financial analyst is also available everywhere in the Sapient experience, so the physician can focus on their day to day without having to troubleshoot on their own. If we notice a downward trend, physicians are informed and notified that their analyst is already on the case.
Project Details
My Role: Lead UX Designer, UI Designer, User Researcher
Team: CEO, VP of Intelligent Solutions, 2 Business Intelligence Analysts